
Petrol
Latest available175.3p/L
Increased by 0.4p this week
12 October 2026 · UK average
Source: GOV.UK / DESNZ (full source: GOV.UK / DESNZ: Weekly road fuel prices; opens in a new tab)
Now
The latest available UK fuel-price data, updated automatically.
Pump prices, Fuel Duty, VAT, crude oil, exchange rates and other indicators are shown with their relevant date and source.
The petrol and diesel figures are UK weekly average pump prices published by GOV.UK / DESNZ. They are not live prices at individual stations. For station prices, see fuel prices on Google Maps and Waze.
Latest
Pump prices are weekly national averages published by GOV.UK / DESNZ. The time above is when we last checked, not when prices were measured.
175.3p/L
Increased by 0.4p this week
12 October 2026 · UK average
Source: GOV.UK / DESNZ (full source: GOV.UK / DESNZ: Weekly road fuel prices; opens in a new tab)
200.0p/L
Increased by 0.5p this week
12 October 2026 · UK average
Source: GOV.UK / DESNZ (full source: GOV.UK / DESNZ: Weekly road fuel prices; opens in a new tab)
52.95p/L
Next scheduled change: 55.95p from 1 January 2027 (final rate to be confirmed at Budget 2026).
20%
Charged on the price including Fuel Duty.
Source: GOV.UK (full source: GOV.UK: VAT rates; opens in a new tab)
Weekly update
Latest movement in the indicators we track. Publishers update on different days, so the dates differ.
175.3p/L
Increased: +0.4p
Week commencing 12 October 2026
200.0p/L
Increased: +0.5p
Week commencing 12 October 2026
52.95p/L
Unchanged
In force since 15 June 2026
20%
Unchanged
Current standard rate
$127.43/bbl
Increased: +$7.40 since 2 October 2026
Week ending 9 October 2026
$1.3353
Increased: +$0.0128 since 9 October 2026
Rate on 16 October 2026
GOV.UK publishes the pump-price figure, but it does not attribute each week's movement to individual causes. The data therefore cannot tell us exactly why the price changed.
What the figures show over their latest period:
Crude oil is priced in dollars, so oil and exchange rates both feed into what the UK pays, but wholesale and retail prices can move at different speeds and margins also change. These figures show correlation and movement, not how much of the change each factor caused. How a litre is priced
Dashboard
Each indicator shows its own period, geography and source.
175.3pence/litre
Latest figure dated: 12 October 2026. Full source: GOV.UK / DESNZ: Weekly road fuel prices.
200.0pence/litre
Latest figure dated: 12 October 2026. Full source: GOV.UK / DESNZ: Weekly road fuel prices.
52.95pence/litre
Last checked: 15 June 2026. Full source: GOV.UK, Amended Fuel Duty rates: 2026 to 2027.
20%
Last checked: 8 September 2026. Full source: GOV.UK: VAT rates.
127.43US$/barrel
Latest figure dated: 9 October 2026. Full source: U.S. Energy Information Administration (EIA): Weekly Europe Brent Spot Price FOB.
1.3353US$ per £1
Latest figure dated: 16 October 2026. Full source: Bank of England: daily spot exchange rate, US$ into sterling (XUDLUSS).
3.1% per year
Latest figure dated: 16 September 2026. Full source: ONS: Consumer price inflation, UK.
705£/week
Latest figure dated: 15 September 2026. Full source: ONS: Average Weekly Earnings in Great Britain.
12.71£/hour
Last checked: 1 April 2026. Full source: GOV.UK: National Minimum Wage and National Living Wage rates.
8.4£bn
Latest figure dated: 21 August 2026. Full source: HMRC tax receipts and National Insurance contributions for the UK.
£19.92
Based on:
Calculation: 100 miles ÷ 40 mpg × 4.54609 litres × 175.3p/L.
This is an FCE estimate, not an official figure. It covers fuel only and excludes other vehicle costs such as insurance, tax, servicing and depreciation.
New · 8 October 2026
Google Maps and Waze can help motorists compare fuel prices and find cheaper stations. That is useful information, and people should be able to make informed choices.
But comparison tools do not, by themselves, reduce the underlying cost of fuel. A cheaper station may still be expensive, may be too far away to justify the journey, or may not solve the problem for people who have no realistic alternative to driving.
Fuel affordability also depends on taxation, international oil prices, distribution costs and retailer pricing.
Fuel Crisis England believes that better price information should be part of the solution, not the whole solution. We want a serious discussion about fuel affordability, government taxation, transparency and practical measures to ease the burden on motorists.
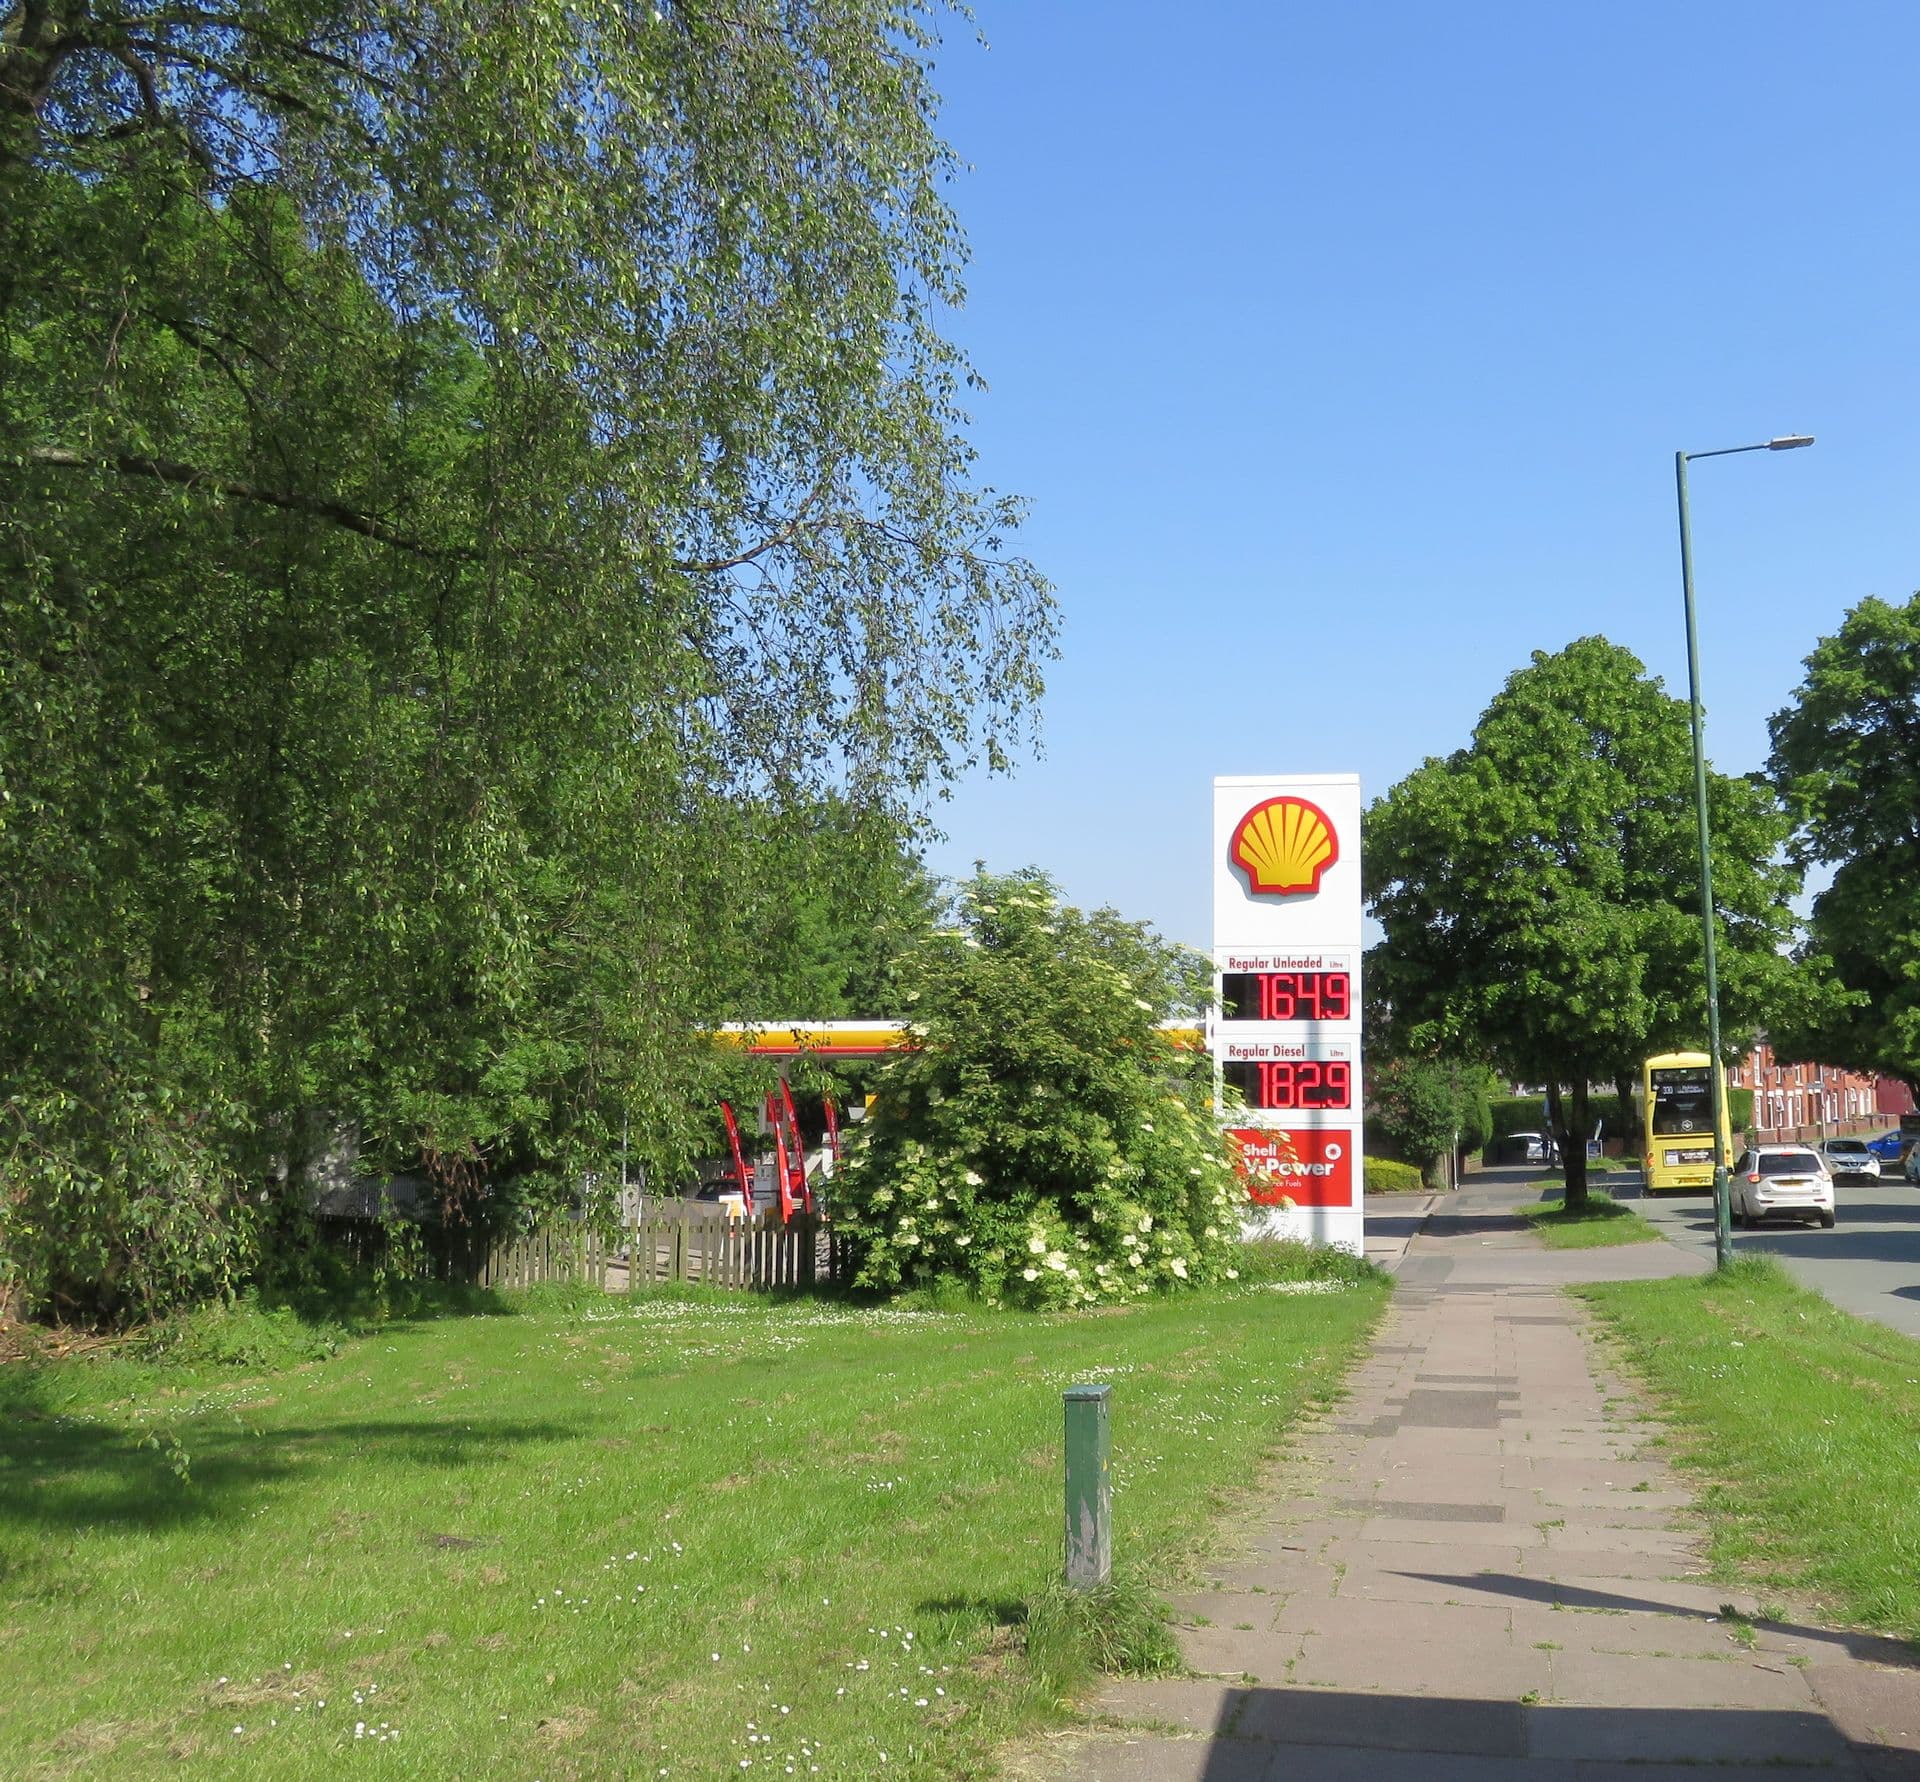
Photo: Gerald England, via Wikimedia Commons (CC BY-SA 2.0)
Campaign commentaryFinding cheaper fuel is useful. Making fuel affordable is the bigger challenge.
Price comparison is one useful part of the picture. The wider challenge needs attention to government policy, including Fuel Duty and VAT, alongside the other costs that sit behind the pump price. Our criticism is not of Google Maps or Waze; it is of treating price comparison as an adequate answer to fuel affordability.
Petrol stations must report price changes to the government's Fuel Finder scheme, so apps can show nearby prices side by side.
If a station within easy reach charges less, a driver can save some money on a fill-up.
Clearer prices make it easier to see where fuel costs less, and to ask why prices differ.
Comparing stations moves a driver from one price to another in the same market. If prices are high everywhere, a cheaper station is still expensive.
Fuel Duty is a flat charge per litre and VAT is added on top. Every station has to include both, and government sets both rates.
Carers, tradespeople, delivery drivers and people in rural areas may have no practical alternative to driving, or few stations within reach.
Extra miles use fuel and time. Try the detour calculator to see when the saving is used up.
Fuel is an essential cost for many households and for businesses that run on the road.
What this site shows
UK weekly average pump prices
175.3p petrol · 200.0p diesel
One national figure per fuel per week, published by GOV.UK / DESNZ for the week of 12 October 2026. It is an average across the country, not the price at any one station, and not a live price.
What Google Maps and Waze show
Prices reported by individual stations
Each station reports its own prices to the government's Fuel Finder scheme, which the apps draw on. These differ from station to station and can change during the day. Fuel Crisis England does not display station prices; use the apps for those.
The prices come from the government's Fuel Finder scheme. Since February 2026, petrol stations must report price changes within 30 minutes. Google and the government announced the launch on 8 October 2026.
The government says Fuel Finder now reflects around 99% of the fuel sold on UK roads (a measure of fuel sold, not of the number of stations), and that comparing prices could save a household that owns a car about £40 a year on average. The page gives no method for the £40 estimate. We have not verified either figure.
Change the numbers to match your own journey. The starting values are examples, not data about any real station.
Extra driving is priced at the UK weekly average, 175.3p/L (week of 12 October 2026, GOV.UK / DESNZ). It is an average, not a station price.
Check the actual difference in Google Maps or Waze.
Example value. Use your own.
On these numbers the drive saves you about £0.14. It stops paying for itself beyond roughly 6.8 extra miles.
How it works: saving = litres × price difference. Extra driving = extra miles ÷ mpg × 4.546 litres per gallon × the average price. It leaves out your time, wear and tear, and any other trips. It is an illustration, not a prediction.
Sources: Google: fuel prices in Google Maps and Waze (UK) (opens in a new tab) · GOV.UK, 8 October 2026 (opens in a new tab) · GOV.UK: Fuel Finder (opens in a new tab)
Better price information should be part of the solution.
Add your voice on fuel affordability. This is an FCE campaign petition, not an official UK Parliament petition.
2026 so far
| Measure | Petrol | Diesel |
|---|---|---|
| Latest availableLatest available | 175.3p/LWeek commencing 12 October 2026 | 200.0p/LWeek commencing 12 October 2026 |
| 2026 year-to-date average | Not yet available | Not yet available |
| 2026 full-year average | Not yet available | Not yet available |
Where does your money go?
An illustrative breakdown of the current petrol price using the latest verified pump price and current tax rates.
Based on a petrol price of 175.3p/litre in 2026. The exact split varies with the fuel price, wholesale costs, retailer margins, and VAT at any given time — this is not a fixed formula.
The wholesale, refining, distribution and retail figures are estimates and should not be interpreted as company profit.
Prices at the pump
Two petrol stations, sometimes only a few miles apart, can charge noticeably different prices for the same fuel on the same day. No single factor explains every difference, and a higher price at one station does not automatically mean wrongdoing.
Fuel Finder is the UK's government-backed open-data scheme for reporting road-fuel prices. Retailers are required to report price changes, within 30 minutes, under the Motor Fuel Price (Open Data) Regulations 2025. The scheme has been operational since February 2026.
As of the CMA's August 2026 report, an estimated 97% of stations were registered, covering an estimated 99% of fuel sales volume. The CMA describes this as an indicative estimate, not an audited figure.
FCE links to the official scheme and guidance rather than presenting an unverified live station-price map of its own. Fuel Finder is not operated by Fuel Crisis England.
Sources: GOV.UK: Fuel Finder and CMA Enhanced Road Fuel Monitoring report, August 2026
A higher price is not automatically profiteering, and a lower price is not automatically better.
Transparency
Every source is listed on our Sources & Methodology page.
See how today compares with completed historical years, side by side.